A visual interface to California’s energy consumption data
The Challenge
How to communicate a wide range of energy consumption data to citizens and policy makers for making informed decisions
The Result
A comprehensive online dashboard thats maps energy consumption on various geographic levels
Our Expertise
- Ideation
- Data Analysis & Visualization
- Map-Making
- Dashboard Design
- Full-Stack Development
The Brief
The California Center for Sustainable Communities (CCSC)'s mission at UCLAs is to create actionable science that improves urban systems' sustainability.
The CCSC approached us to design and realize the LA Energy Atlas as a platform that can meet the needs of different users. On the one hand, it serves to advance the research itself. On the other hand, it informs Californians and anyone else interested in the ongoing energy transitions. Consequently, the application offers an intuitive and easy introduction even for users who are not familiar with the topic.
Our Approach
A first of its kind Web platform built with the most extensive set of publicly available disaggregated energy data in the United States
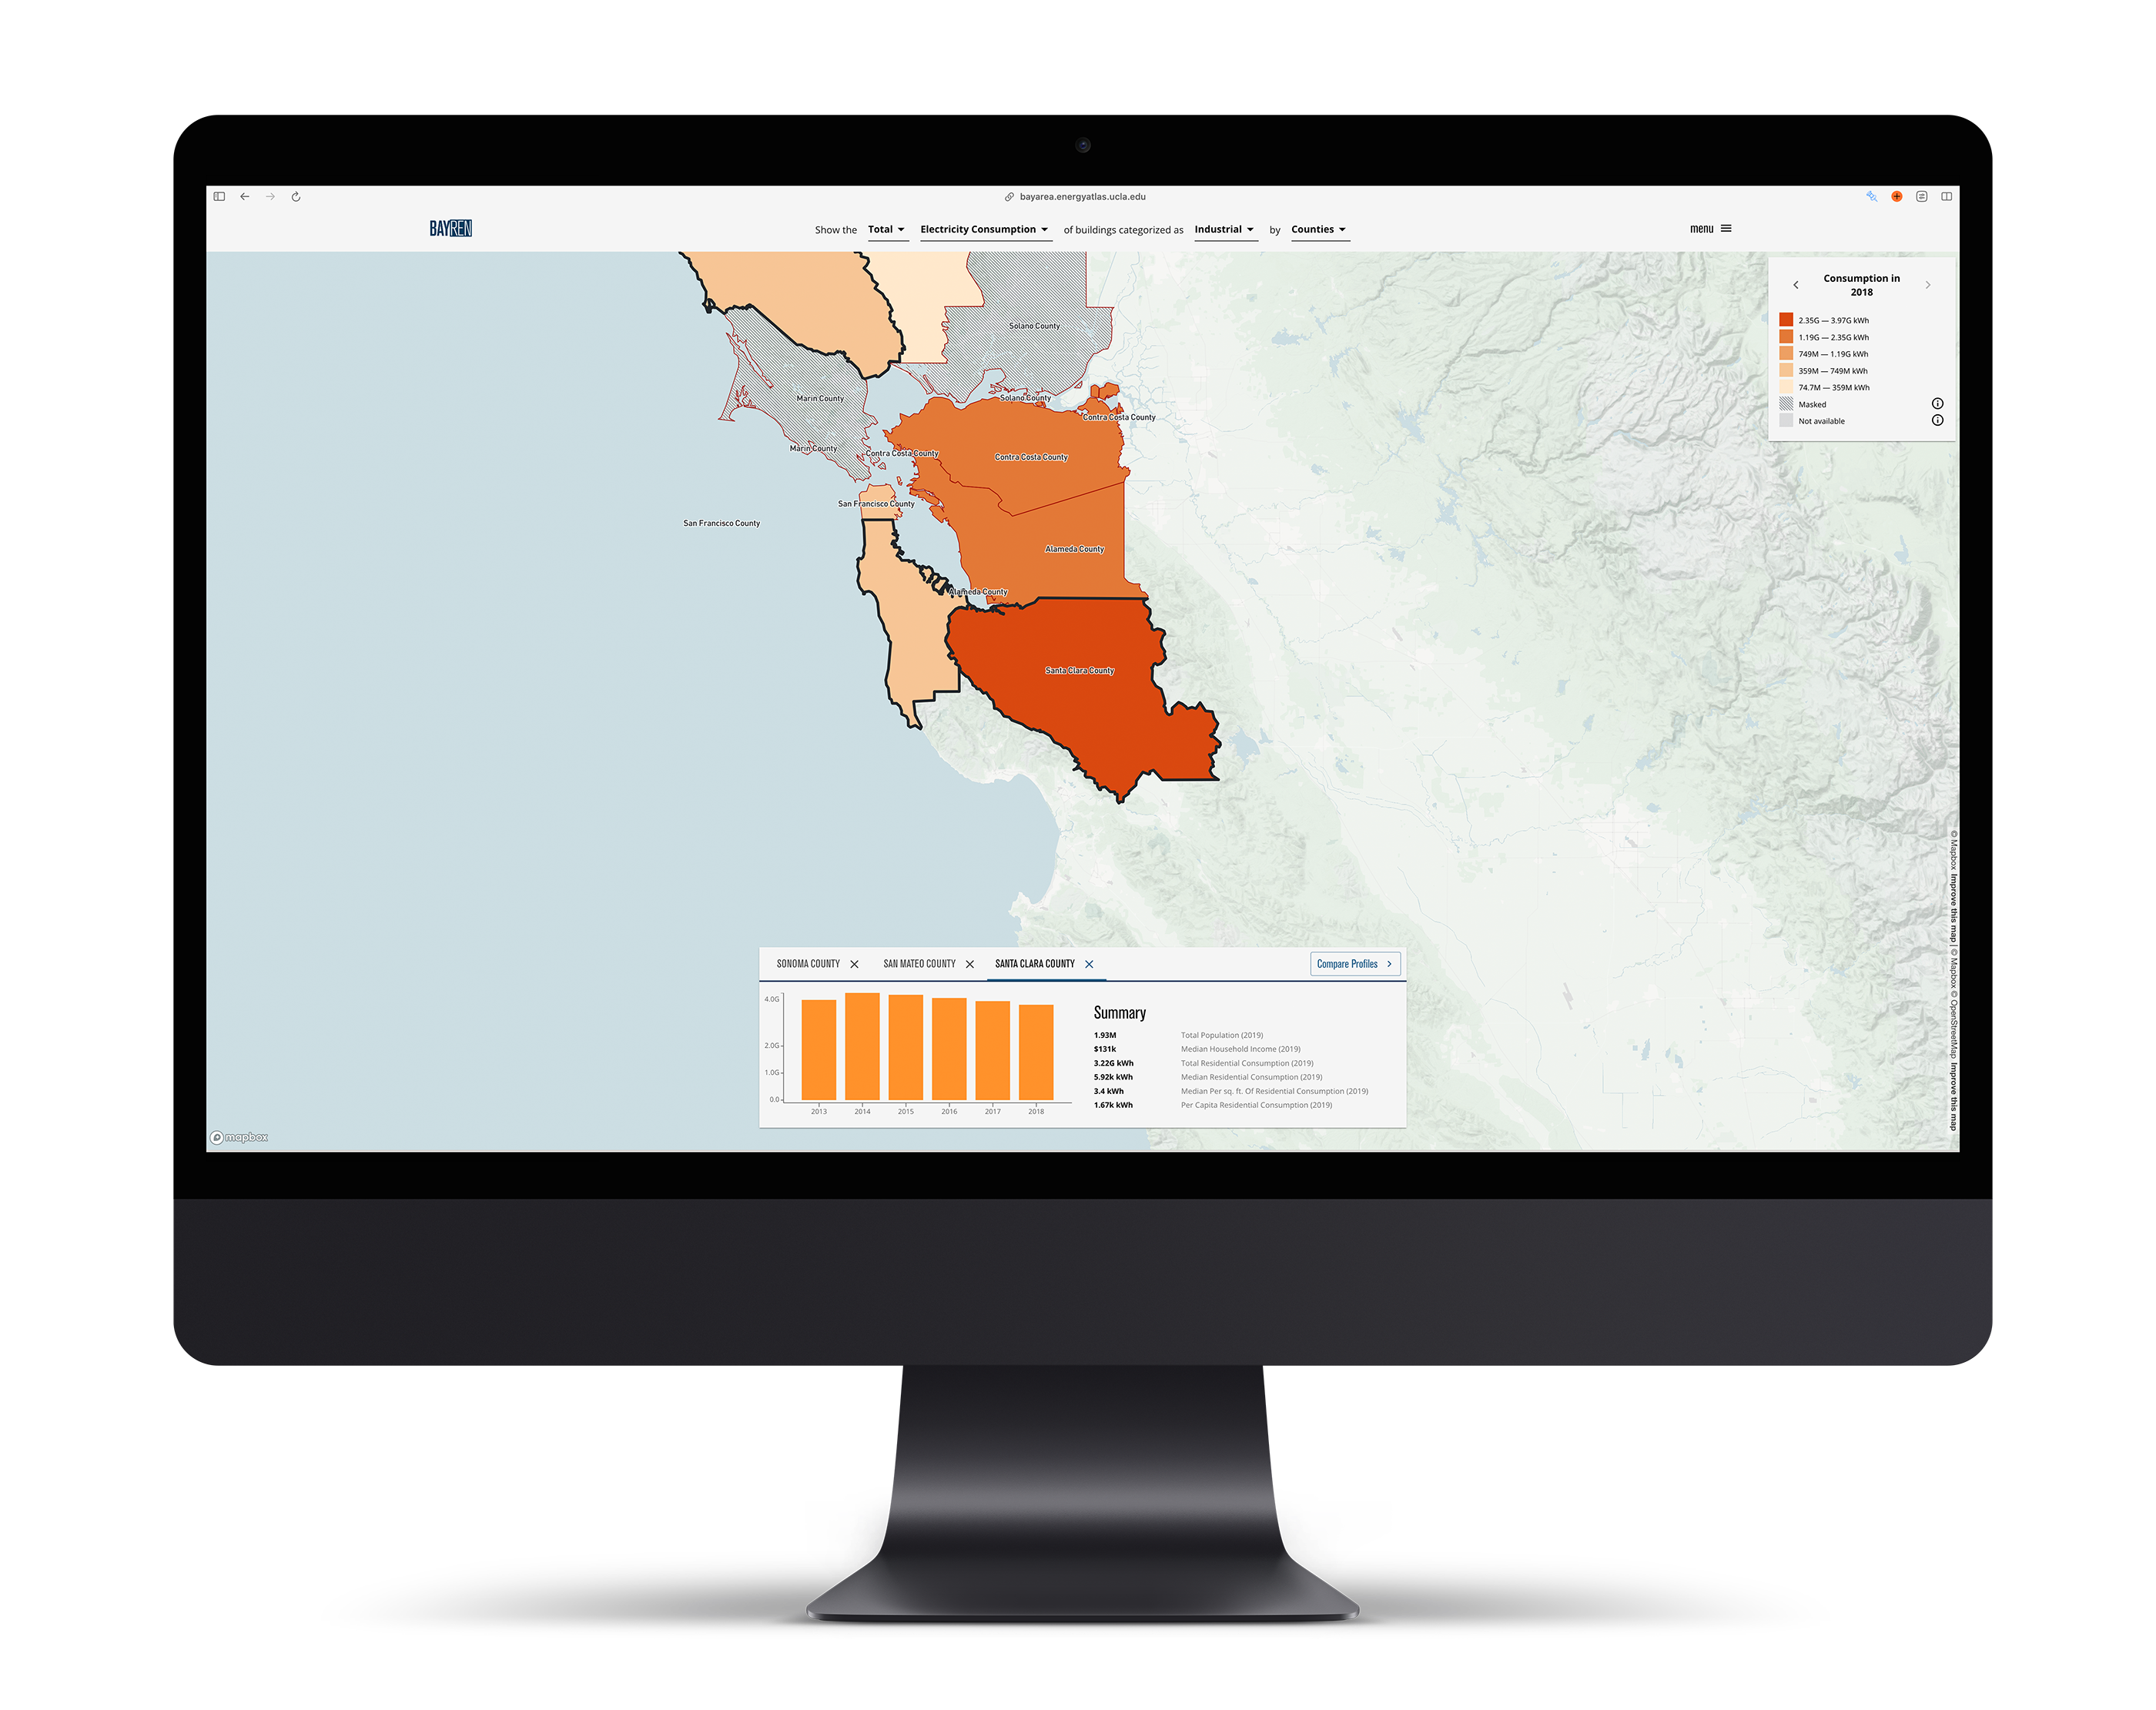
Interactive maps visualize districts, cities, and municipalities' energy consumption down to a detailed level of buildings, which can be filtered by type, age, and greenhouse gas emissions. Thus users can explore the data using different consumption types.
The platform offers the possibility to compare the energy profiles of multiple cities and neighborhoods. Individual profiles support detailed views for each type of consumption, including a temporal sequence of the data.
To support the CCSC in its communication activities, we have developed a CMS that enables the easy creation and embedding of charts and other media into their editorial work. In this way, data stories and studies can be written and made available to the public. »ADA«, our custom CMS allows for different types of block content such as text, media and charts a.o
Credits
Directed by Dr. Eric Fournier, Formerly: Dr. Stephanie Pincetl
Project team: Julia Skrovan, Formerly: Zoe Elizabeth Rob Graham, Kristen Holdsworth, Sinnott Murphy, Jeff Wolf, Thuy Vu, Hannah Gustafson, Lauren Strug
Related Case Studies
View more data visualizations and information interfaces.
Helping one of Germany’s most recognized research institutes to trace innovation
Collaborate with us
Lets find out how we can add value to your business:
Visit us
Our Studio in Berlin
Sophienstr. 18
10178 Berlin
Legal Disclaimer
Privacy Policy