Visualizing the vaccination progress against COVID-19 in Germany
The Challenge
A scalable, single point of information dashboard that provides daily insights into the vaccination progress against COVID-19.
The Result
An accessible, easy-to-use dashboard featuring visualizations based on daily updated data. The dashboard created a new engagement between the government and the public.
Our Expertise
- UX & UI Design
- Full-Stack Development
- Data Analysis & Visualization
The Brief
During the COVID-19 outbreak in 2020, the German Federal Ministry of Health required a single point of information dashboard that provides daily insights into the vaccination progress against SARS-CoV-2.
Our Approach
We designed a set of easy-to-understand interactive visualizations that communicate the vaccination campaign’s state against SARS-CoV-2. At first glance, visitors can view multiple vital indicators such as vaccine doses administered, the daily vaccination rate, and the percentage of the overall vaccinated population.
Vaccination Dashboard App
Visualizations & Features
The site’s data set is updated automatically and includes information about delivered and administered vaccine doses, both on a federal and regional level.
Visitors can explore this information through visualizations that focus on clarity and simplicity, such as a custom-designed vaccination clock.
Vaccination Progress
The chart visualizes how many people have received their first jab, basic immunization, or a booster vaccination during the vaccination campaign.
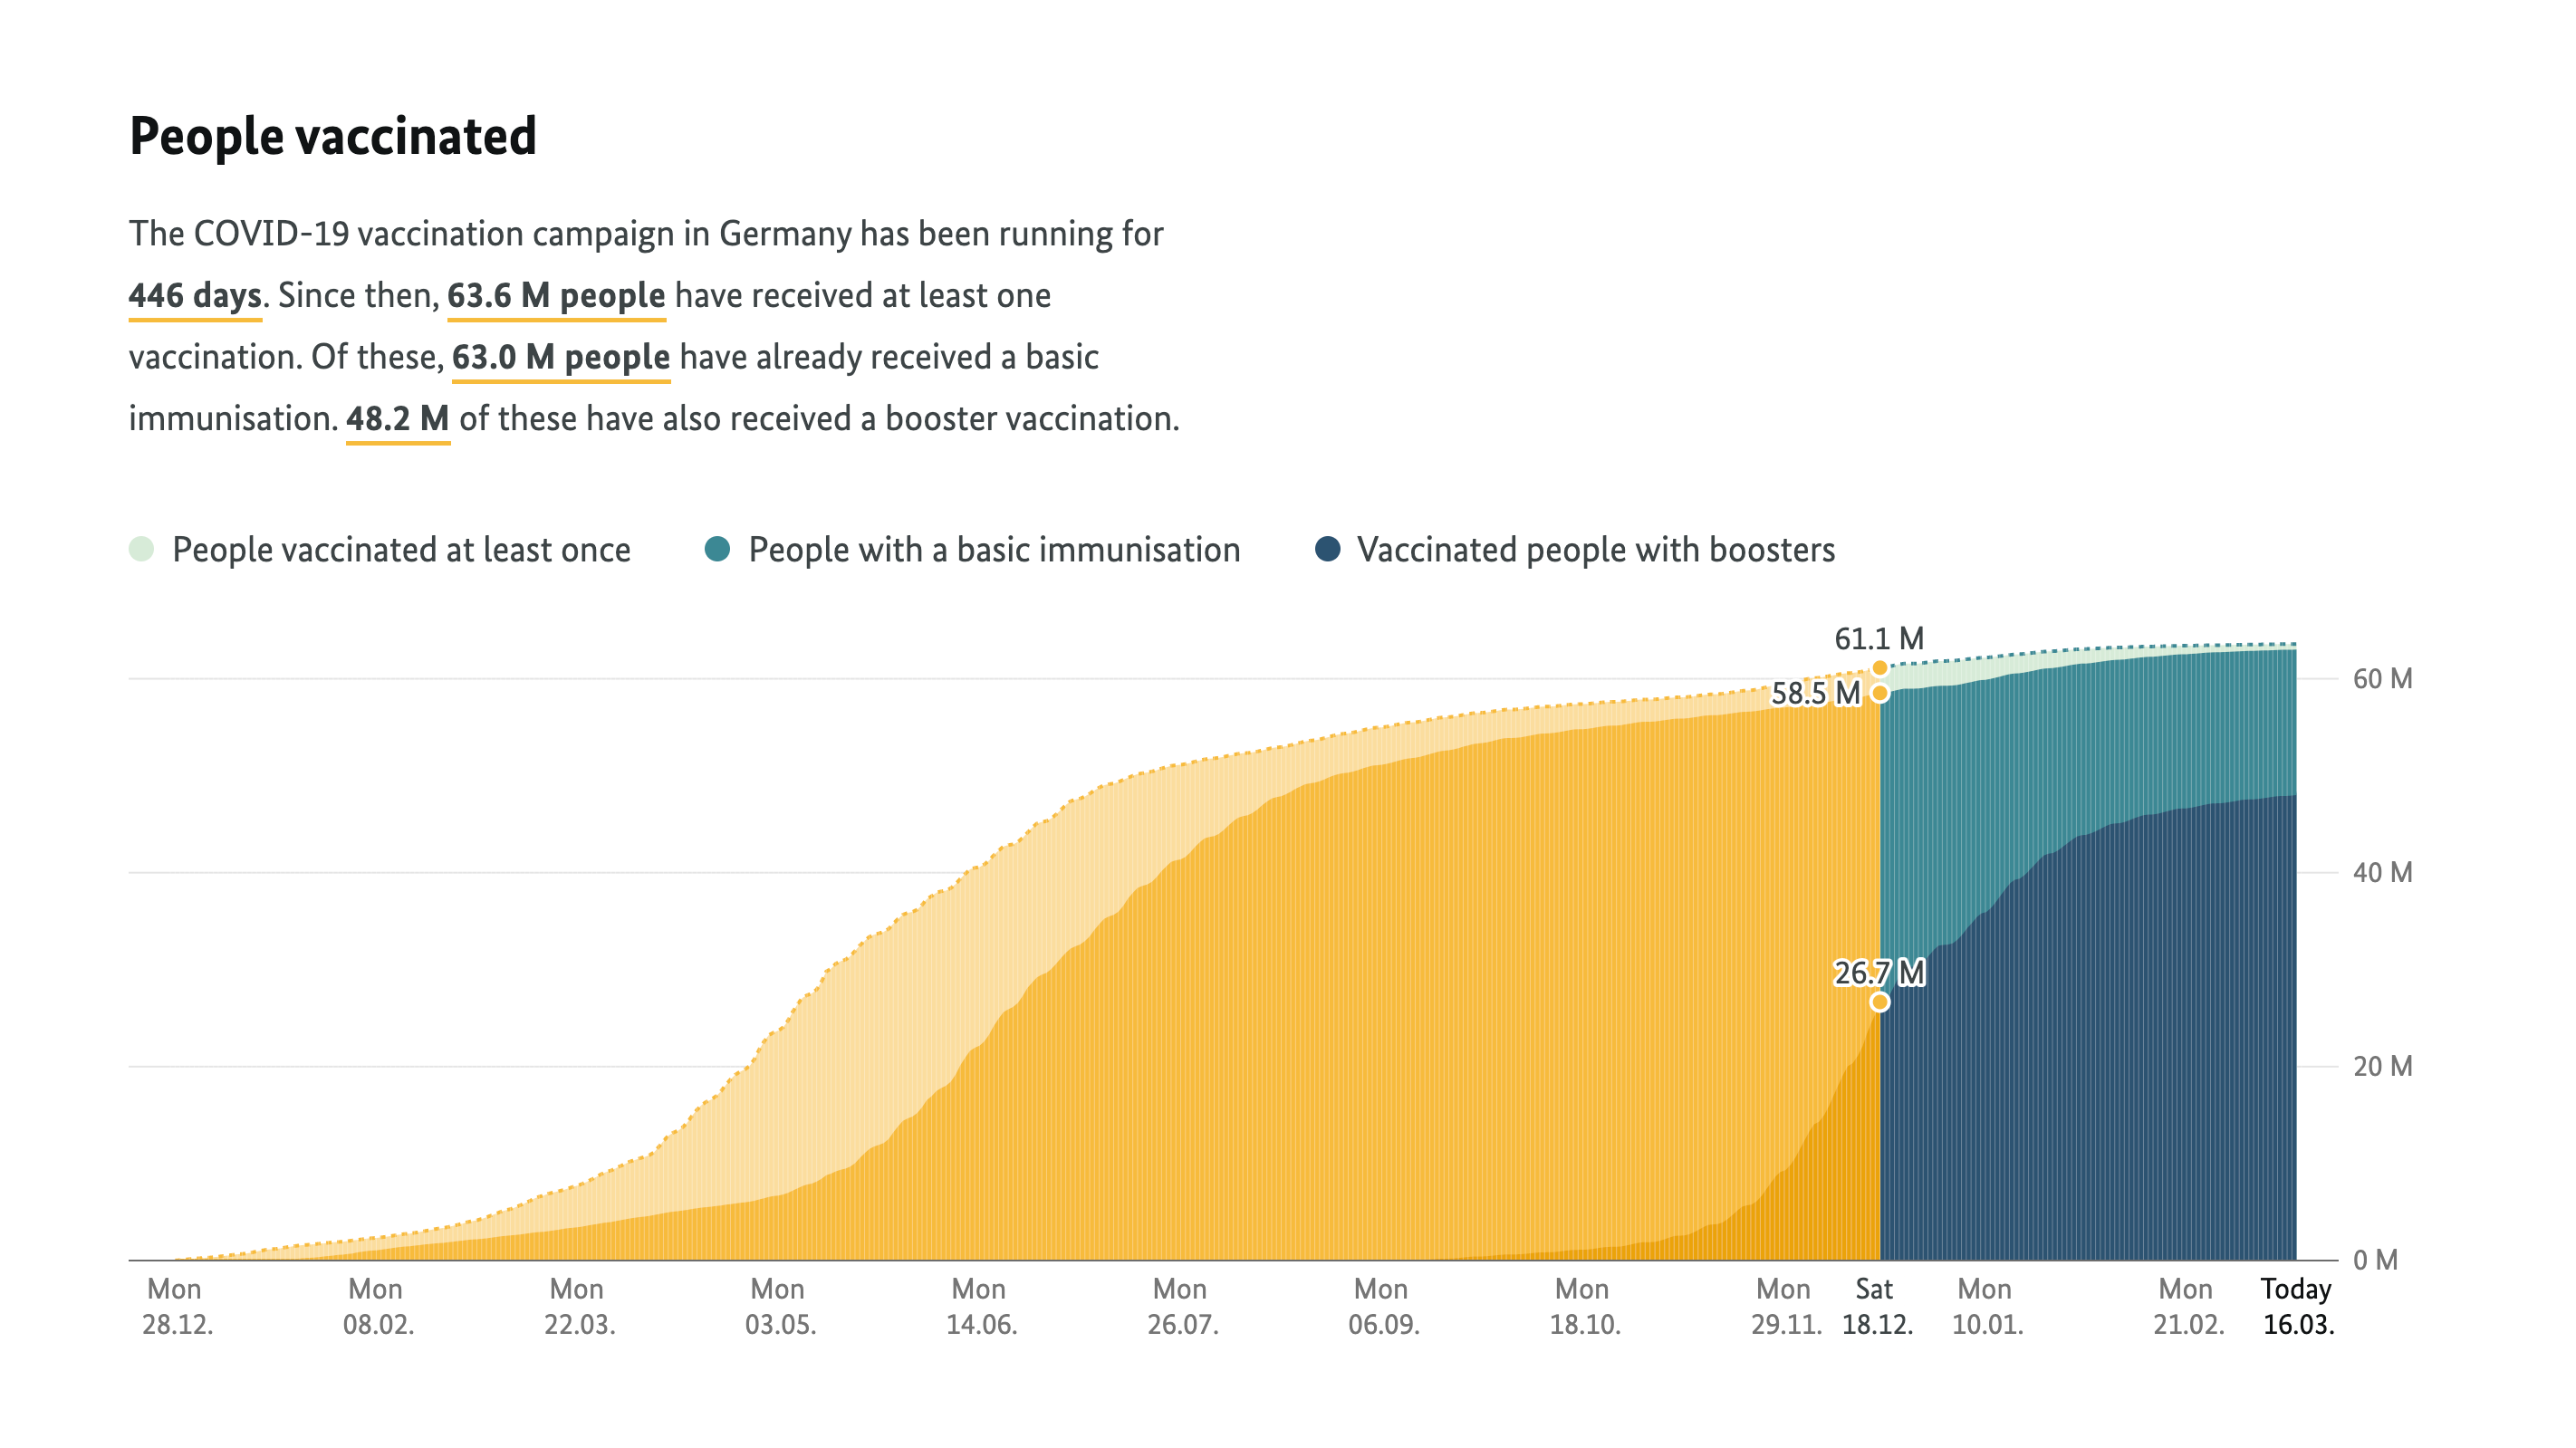
Vaccinated people. light green: first jab, medium green: basic immunization, dark green: booster vaccination
Doses Administered Daily
The chart communicates how many vaccination doses have been administered on which day. Overall administered doses are shown in light blue, with jabs leading to a basic immunization highlighted in medium blue and booster vaccinations highlighted in dark blue.
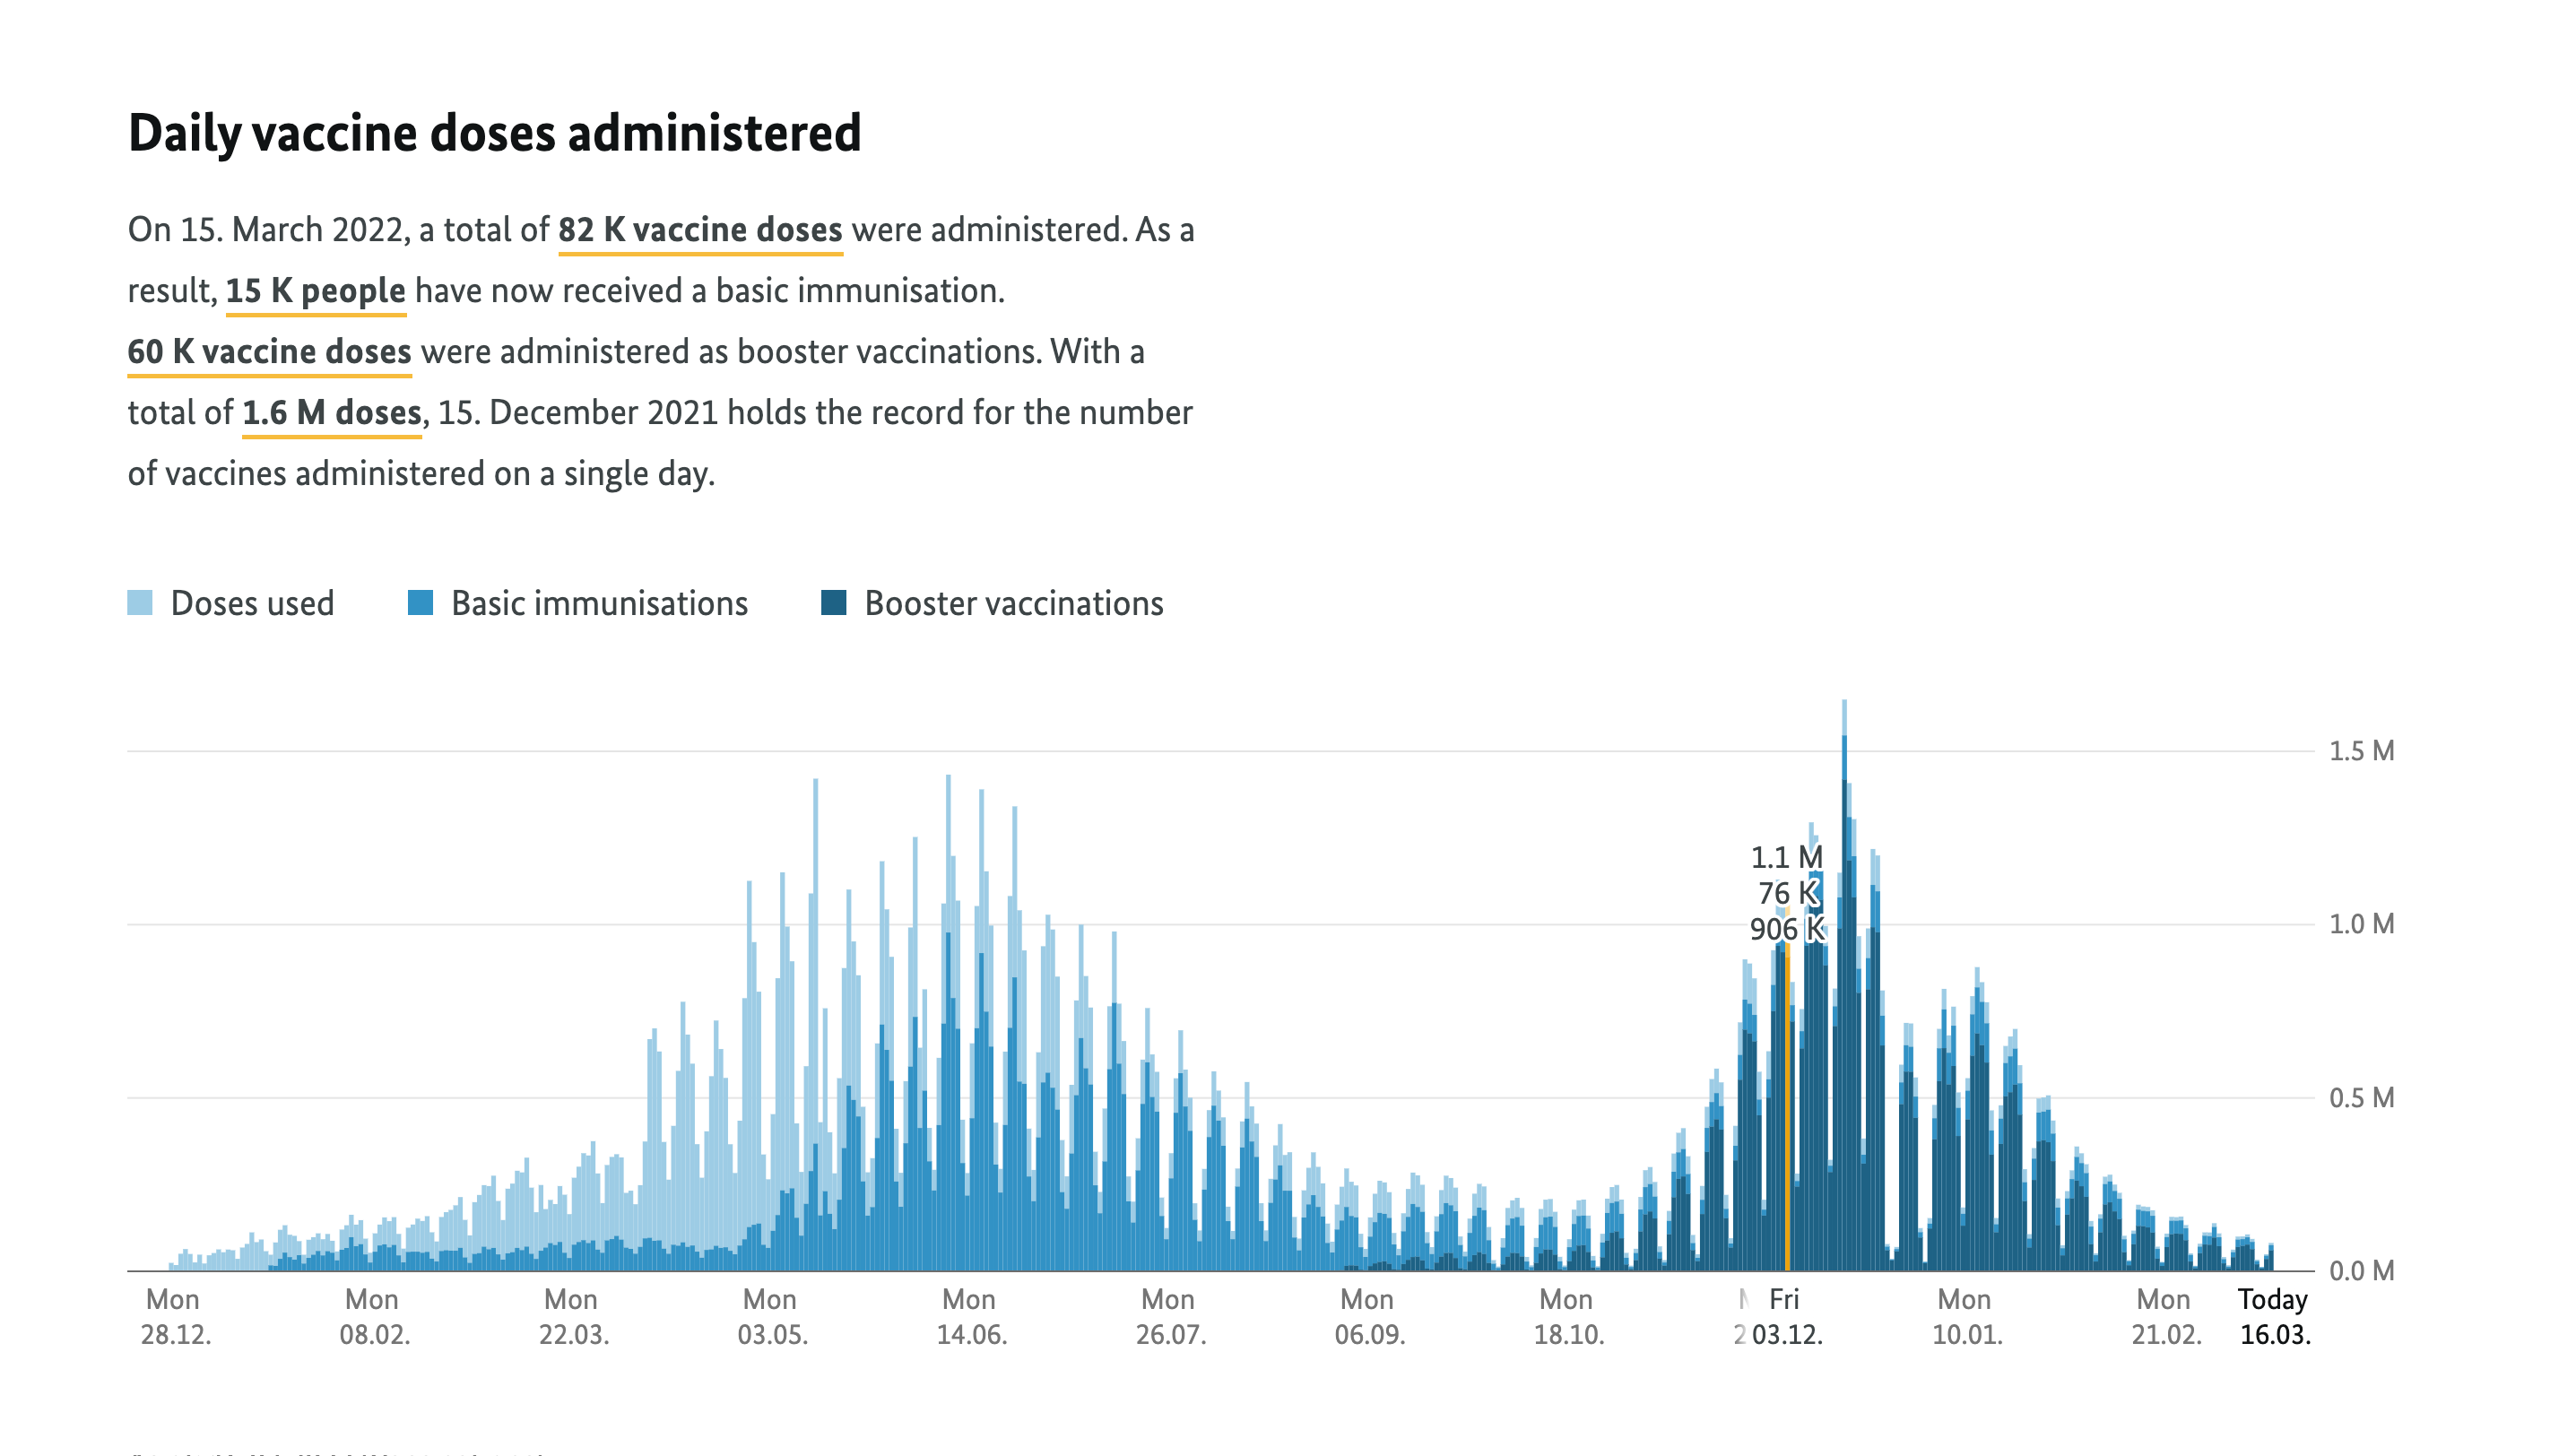
The bar chart interactively shows the vaccination counts per day.
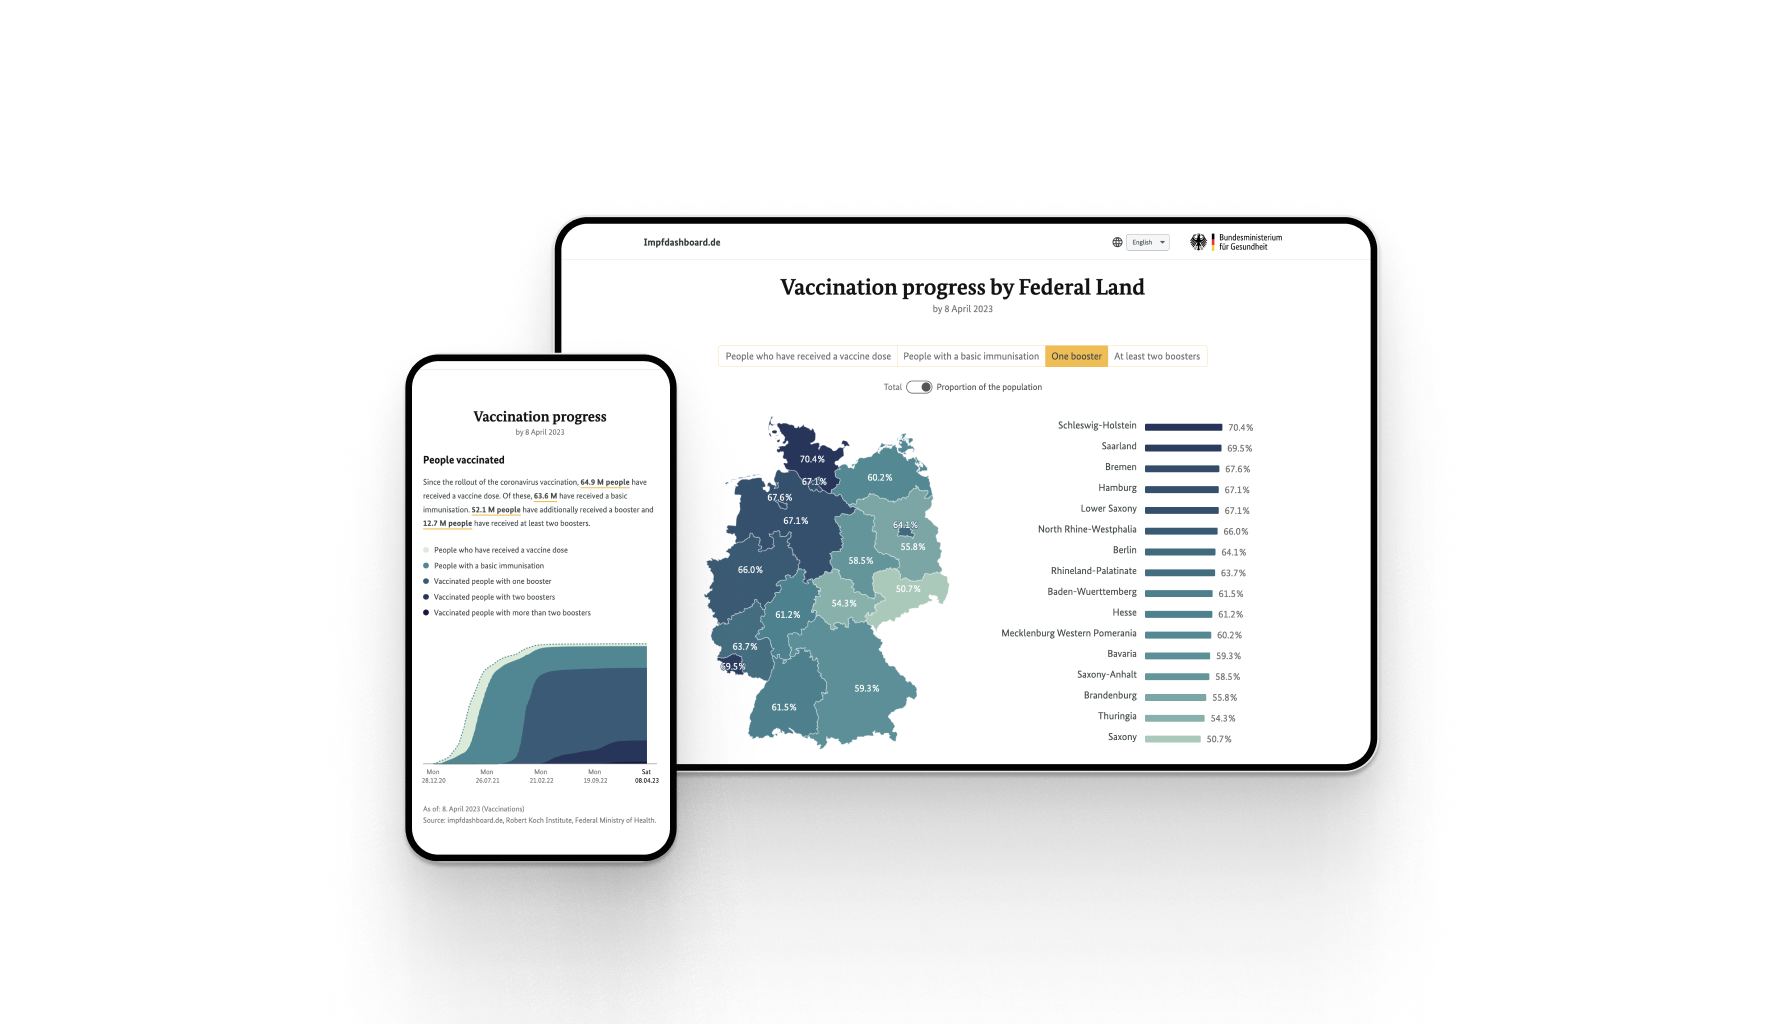
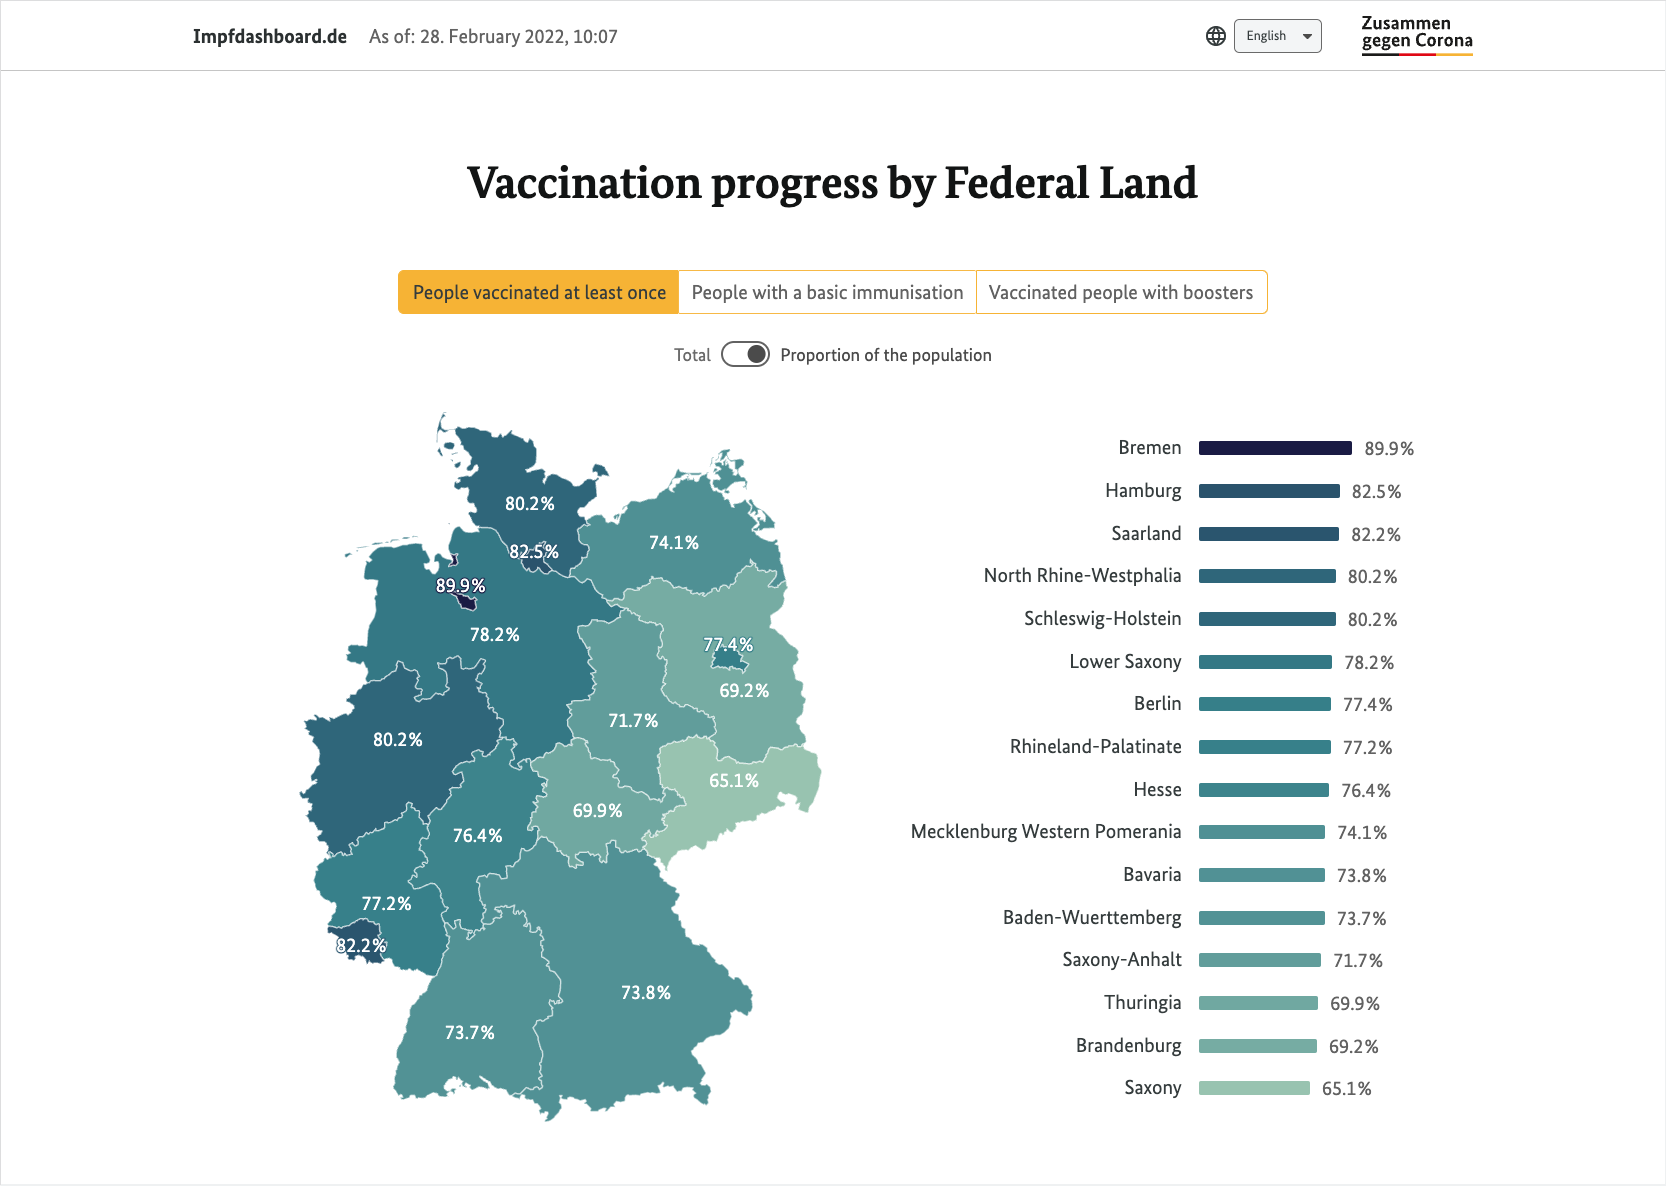
Vaccination Progress by States
A detailed regional breakdown of the number of people who have received their first jab, basic immunization, or a booster vaccination is visualized on a map of Germany.
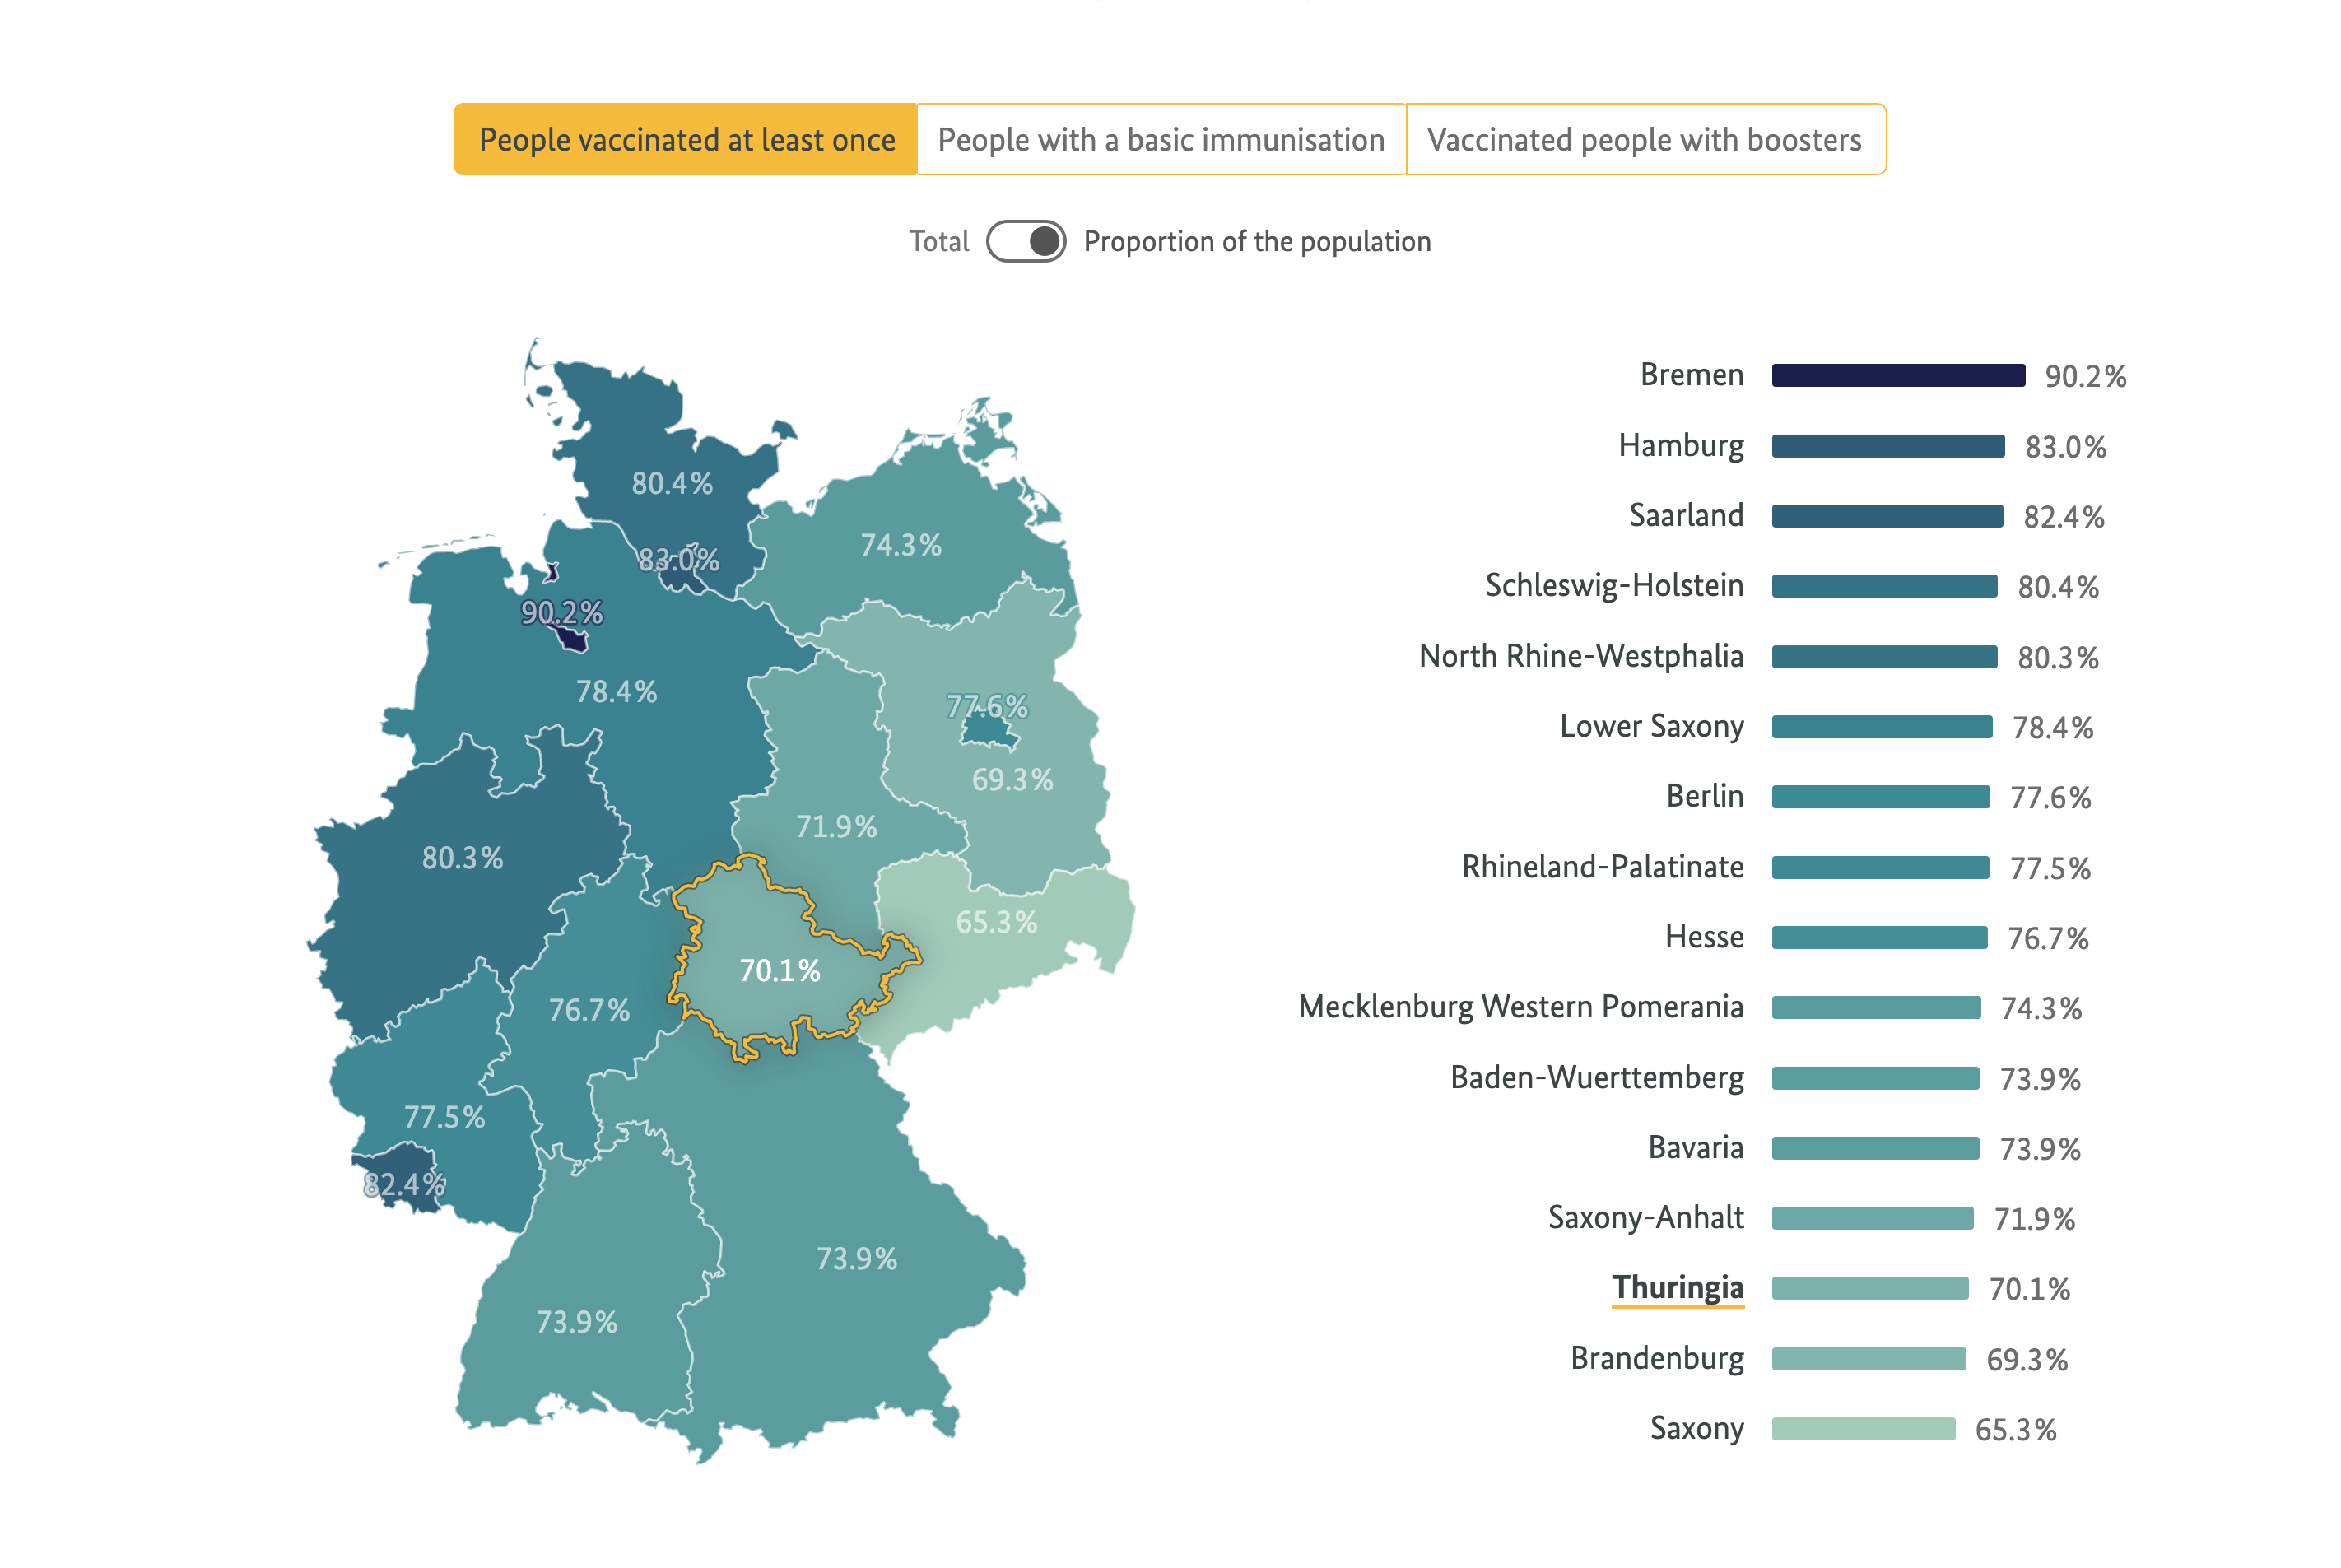
The map allows visitors to compare the detailed data of the vaccination progress between the federal states of Germany.
Vaccine Delivery
The stacked bar chart breaks down the delivered doses by their manufacturer.
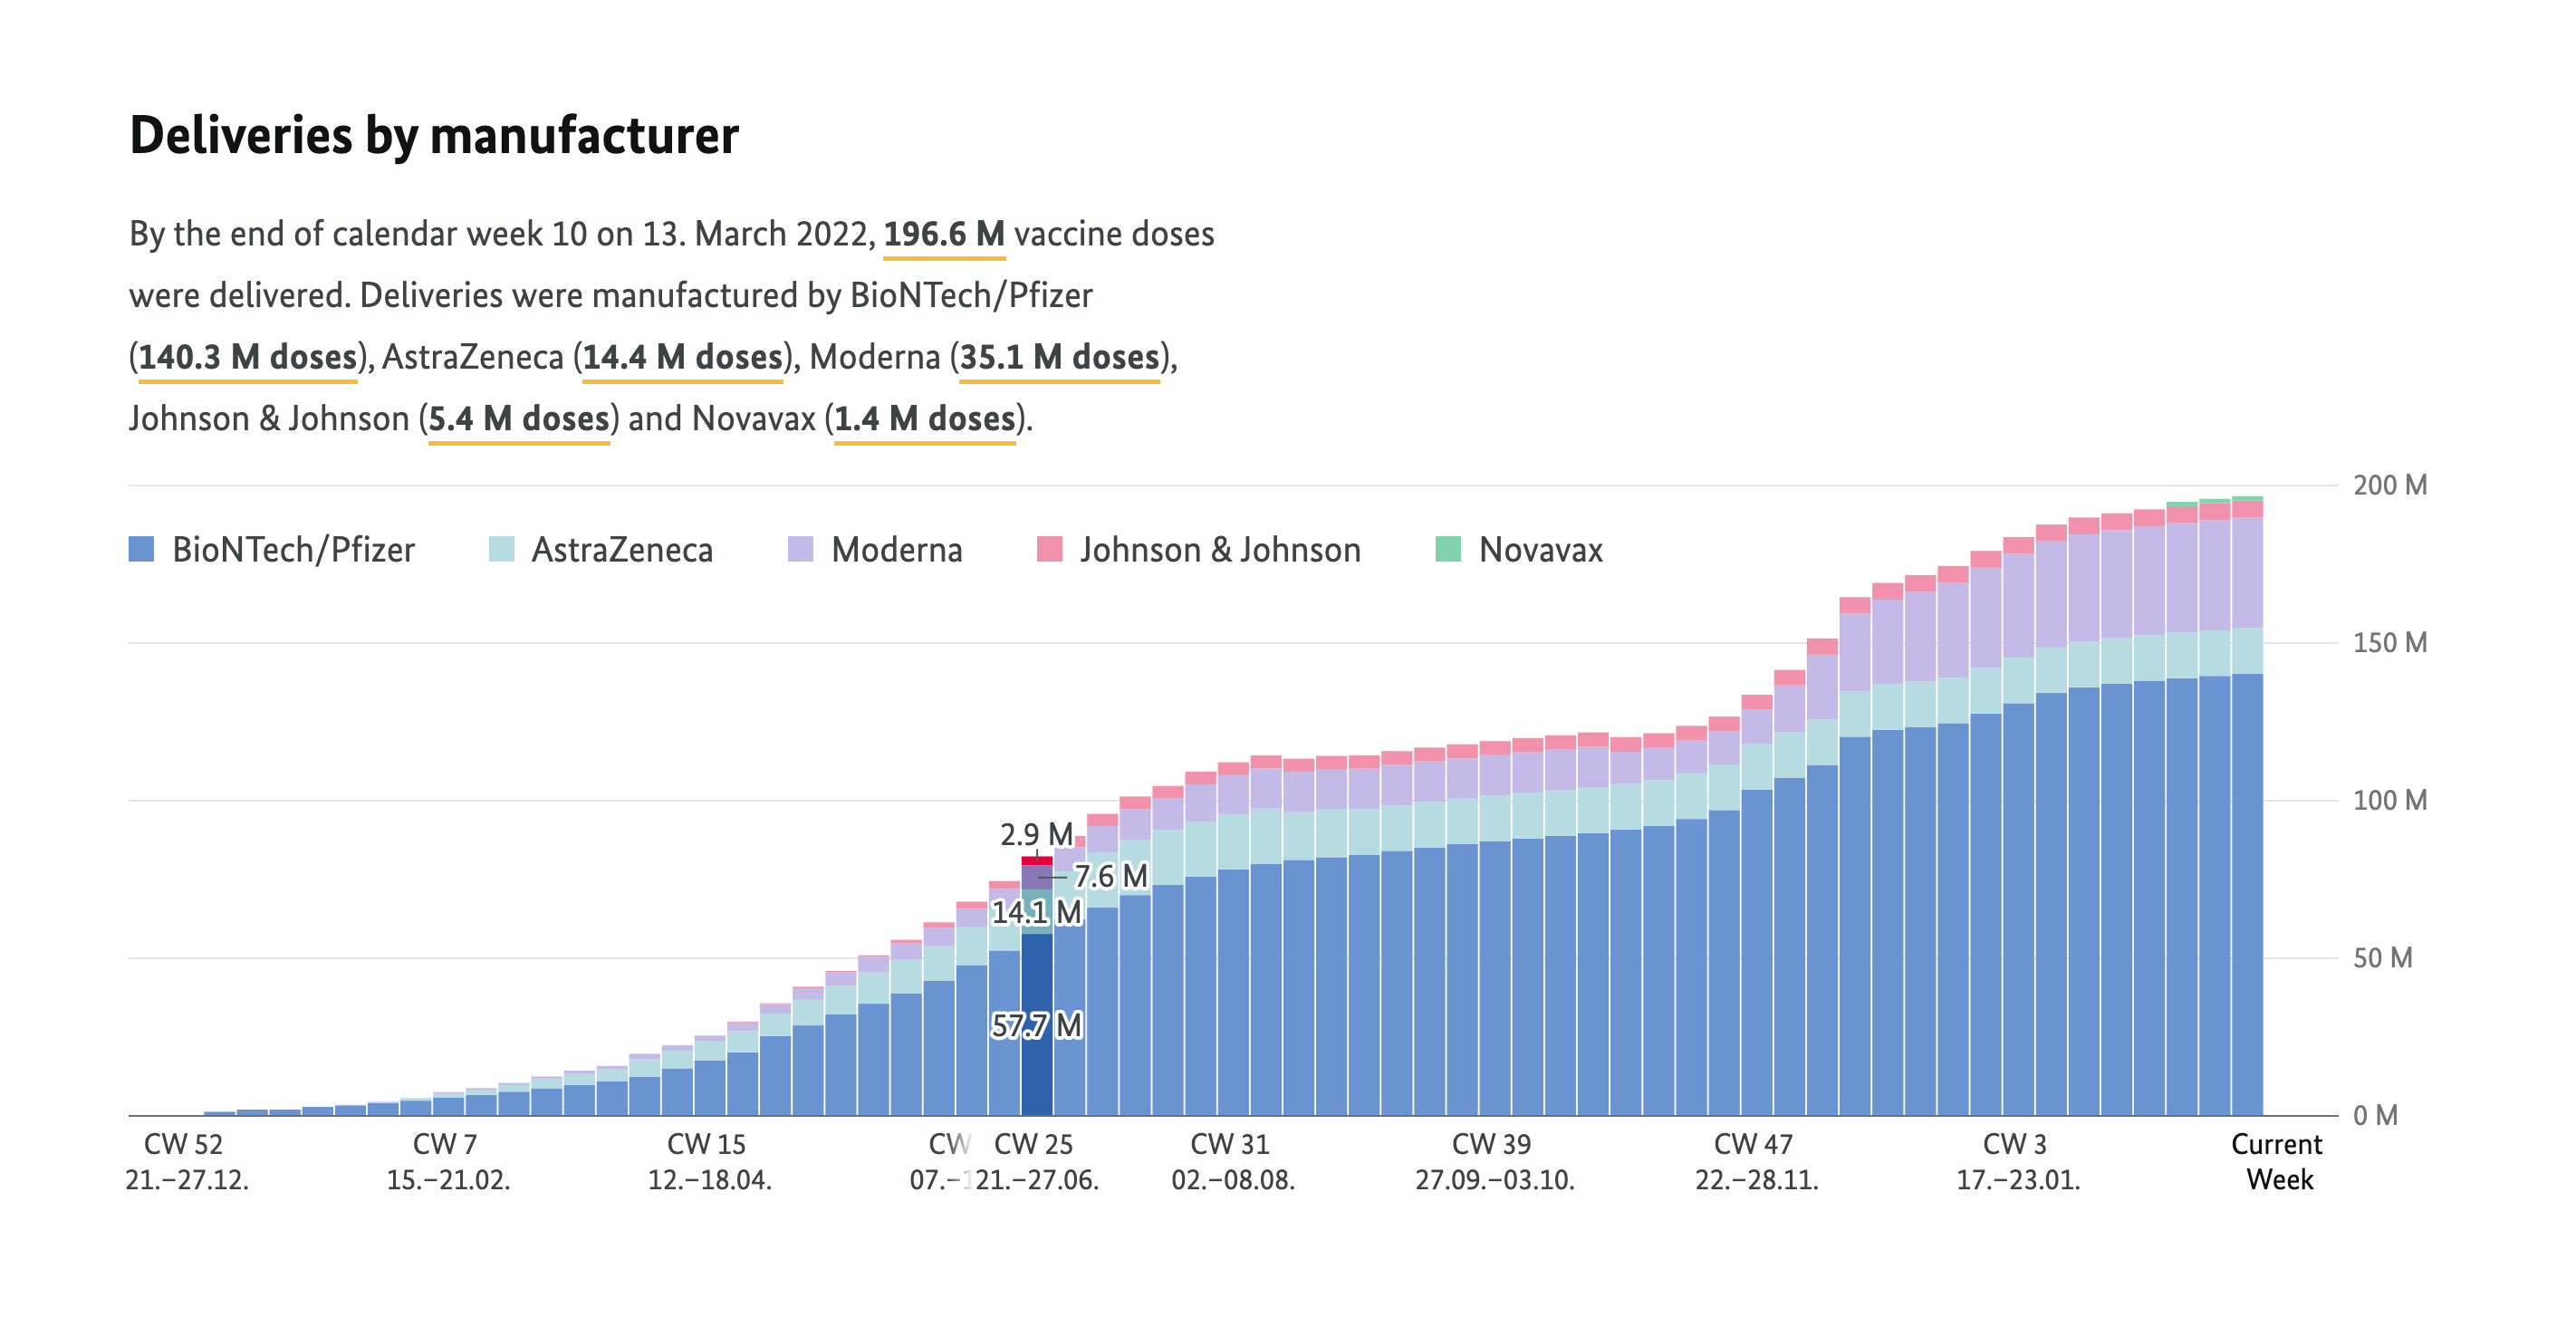
Delivered doses and their manufacturer.
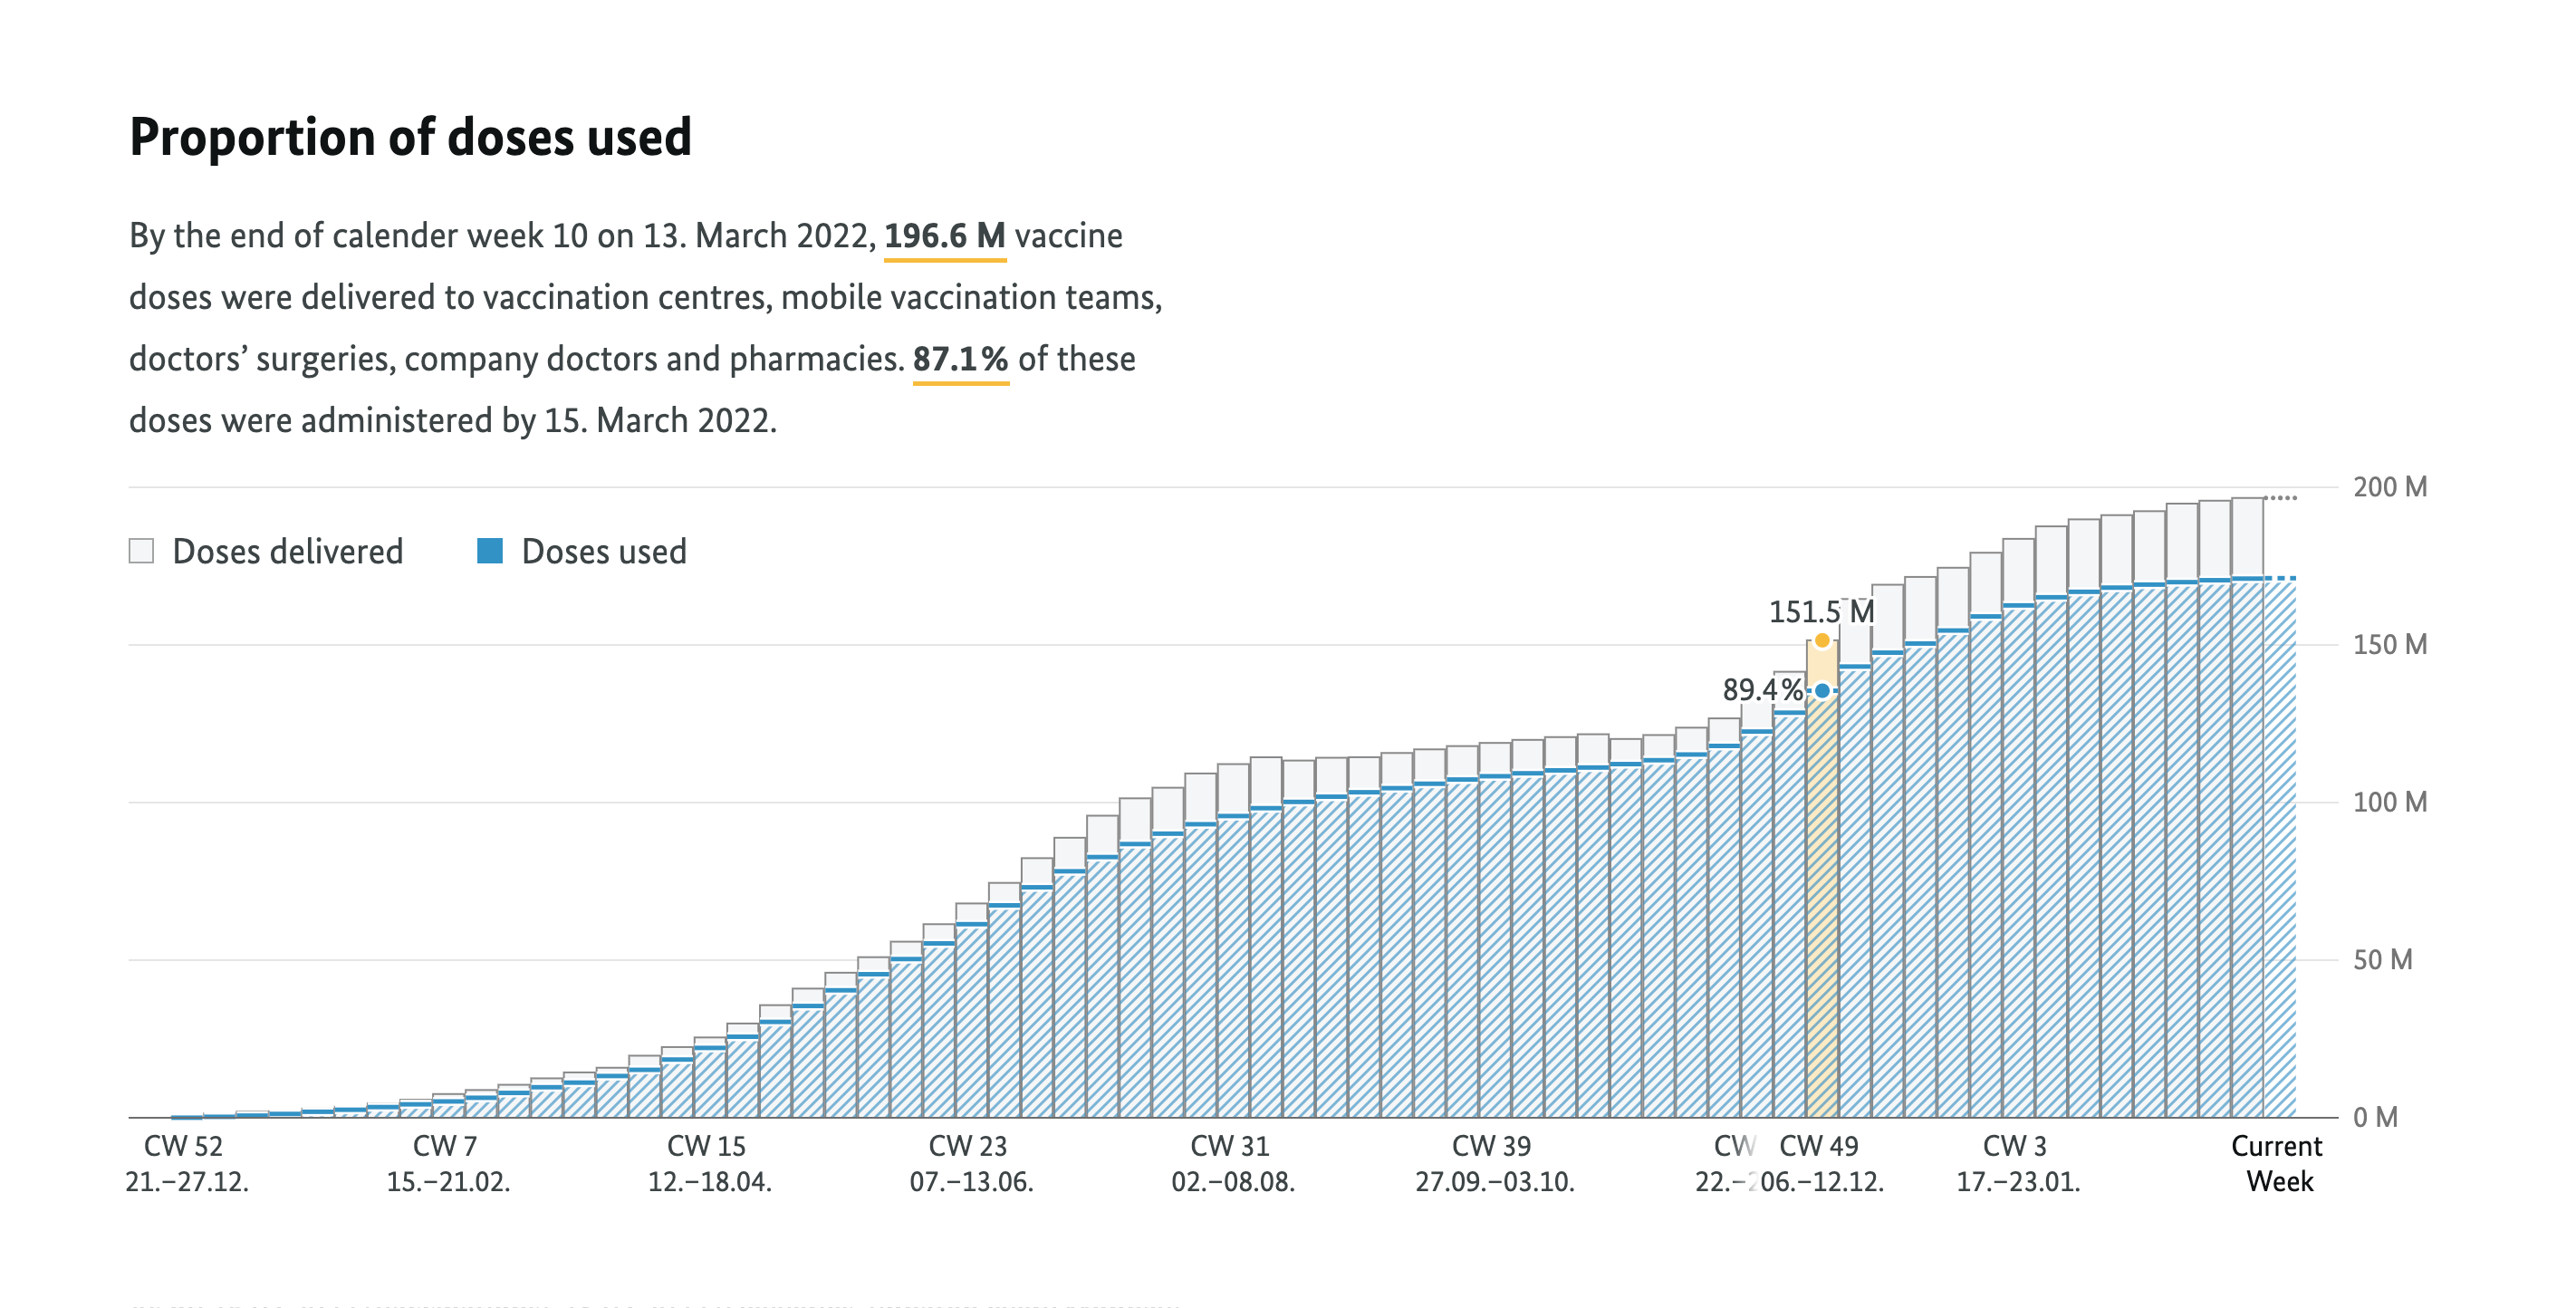
Comparison of how many doses were delivered and how many have been used.
Vaccination progress by age group
Germany approves COVID-19 vaccines for people from the age of five. This age group comprises 79.2 million people. The chart shows how many people have received at least a first jab, basic immunization, or a booster.
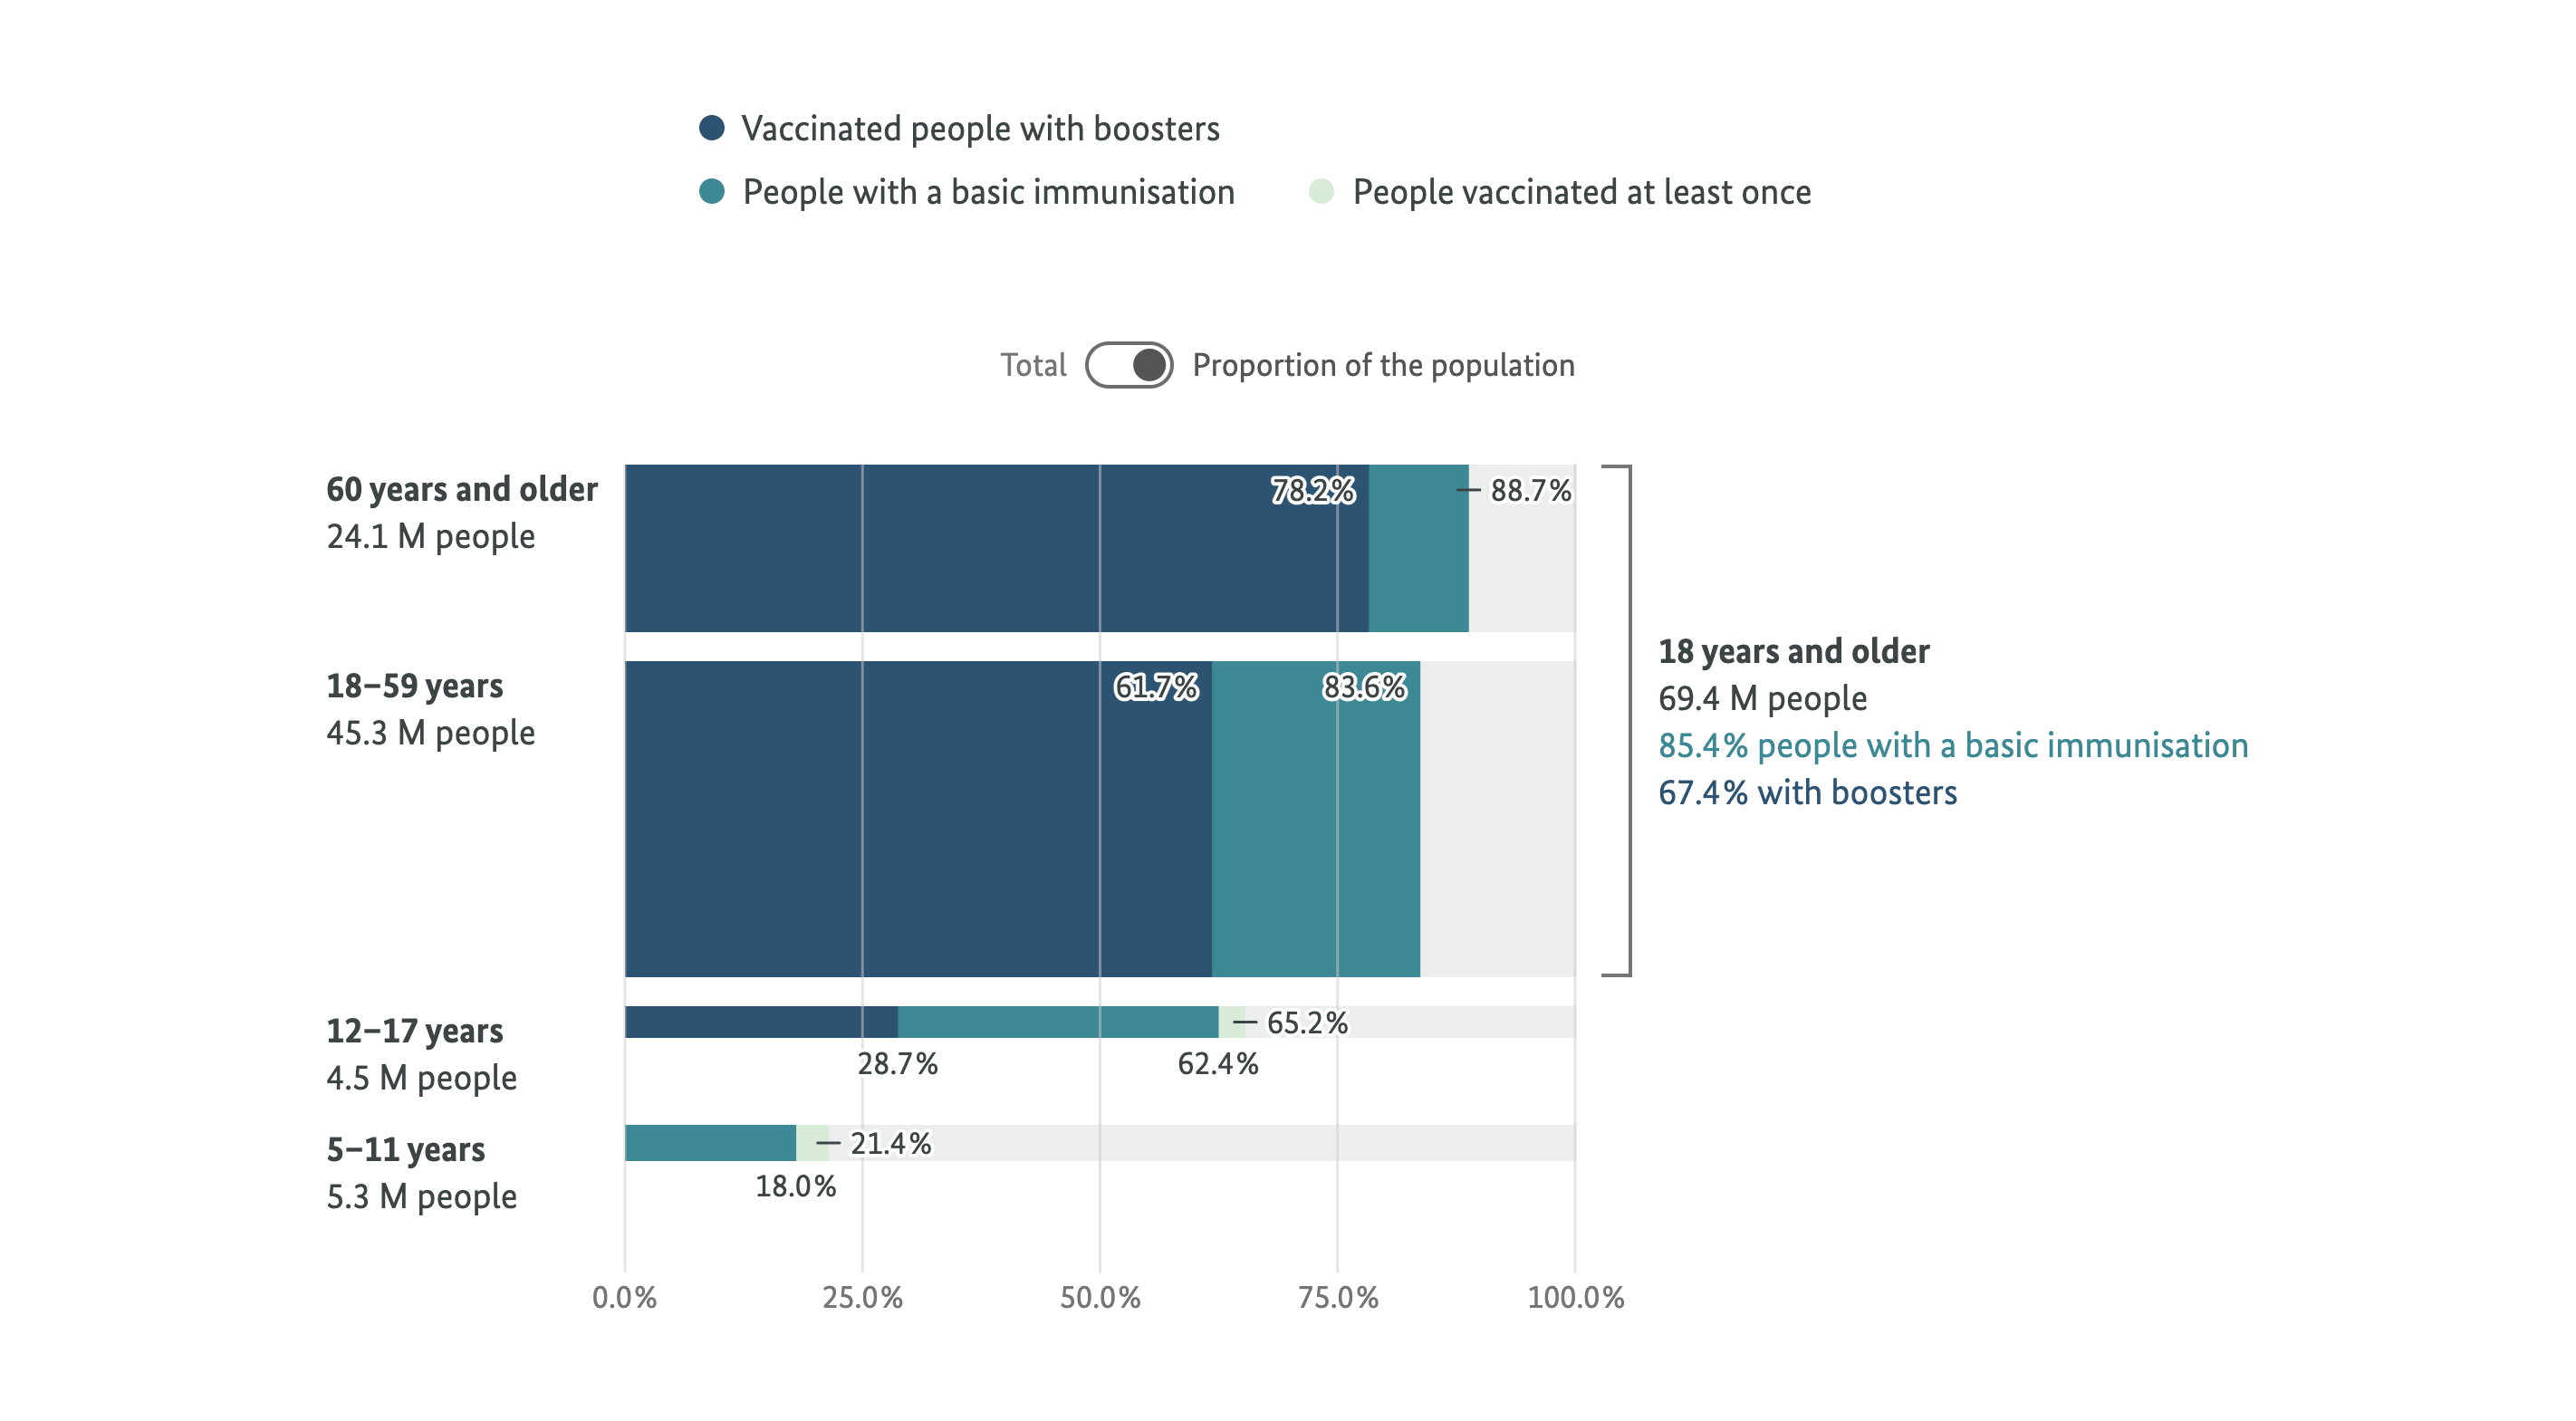
For the 4.0 million people aged between 0 and 4 years , who live in Germany, an approved vaccine is currently not available.
Milestones
Visitors can examine the campaign’s overall progress through a timeline of milestones. This birds-eye view communicates significant developments and achievements, such as vaccine approvals and more than one million people.
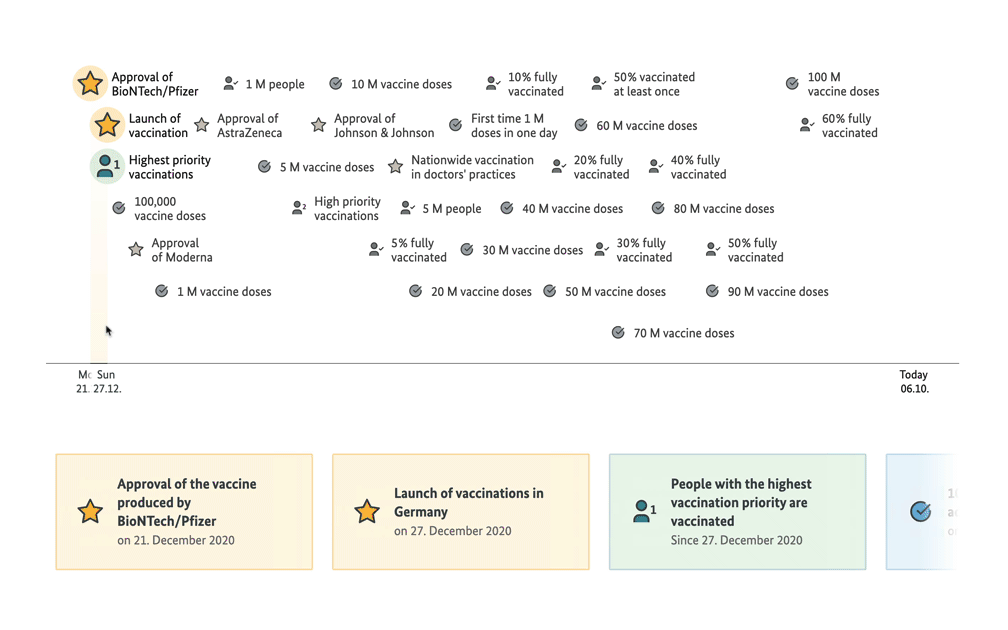
A timeline allows the visitors to move through all past, current, and future vaccination campaign milestones.
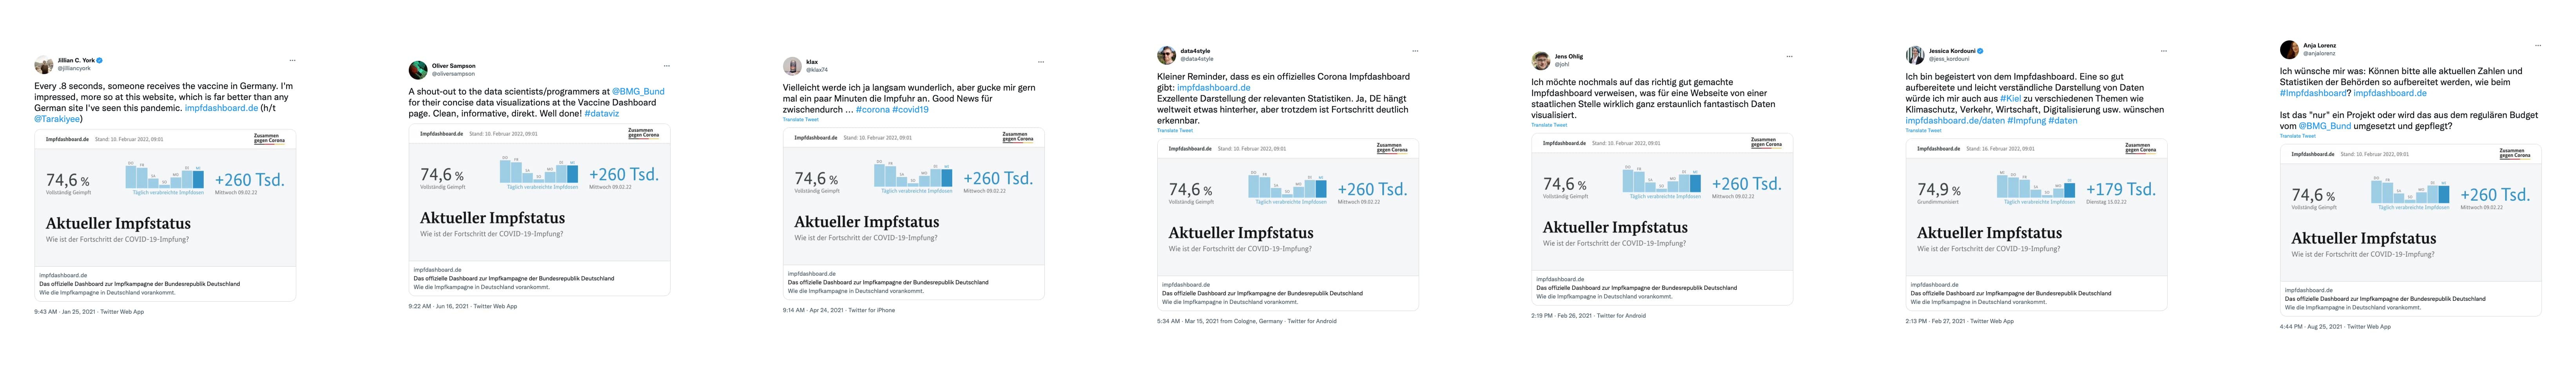
Engagement
Michael Scheunemann – care home managerThe dashboard is brilliant and very informative. It is my favourite spot to inform myself about corona and the vaccination progress.
We designed the website from the ground up for shareability. A link to the dashboard in messengers and social media will always show a preview with the latest data, generated automatically when the data is updated.
Our mobile-first design attaches particular importance to accessibility, usability, and overall broad comprehensibility.
The website is available in English, Türkçe & Русский.
Credits
Published by Federal Ministry of Health
Comissioned by Cosmonauts & Kings
In collaboration with Moritz Stefaner
Related Case Studies
View more data visualizations and information interfaces.
Visualizing scientific data about the harm and benefit of vaccination against COVID-19
Exploring the complex relationships of environmental topics
Collaborate with us
Lets find out how we can add value to your business:
Visit us
Our Studio in Berlin
Sophienstr. 18
10178 Berlin
Legal Disclaimer
Privacy Policy